STRATEGY NOTE
Healthy Cafe Economics
What a Subway India reference case reveals about the economics of building a healthy-food QSR
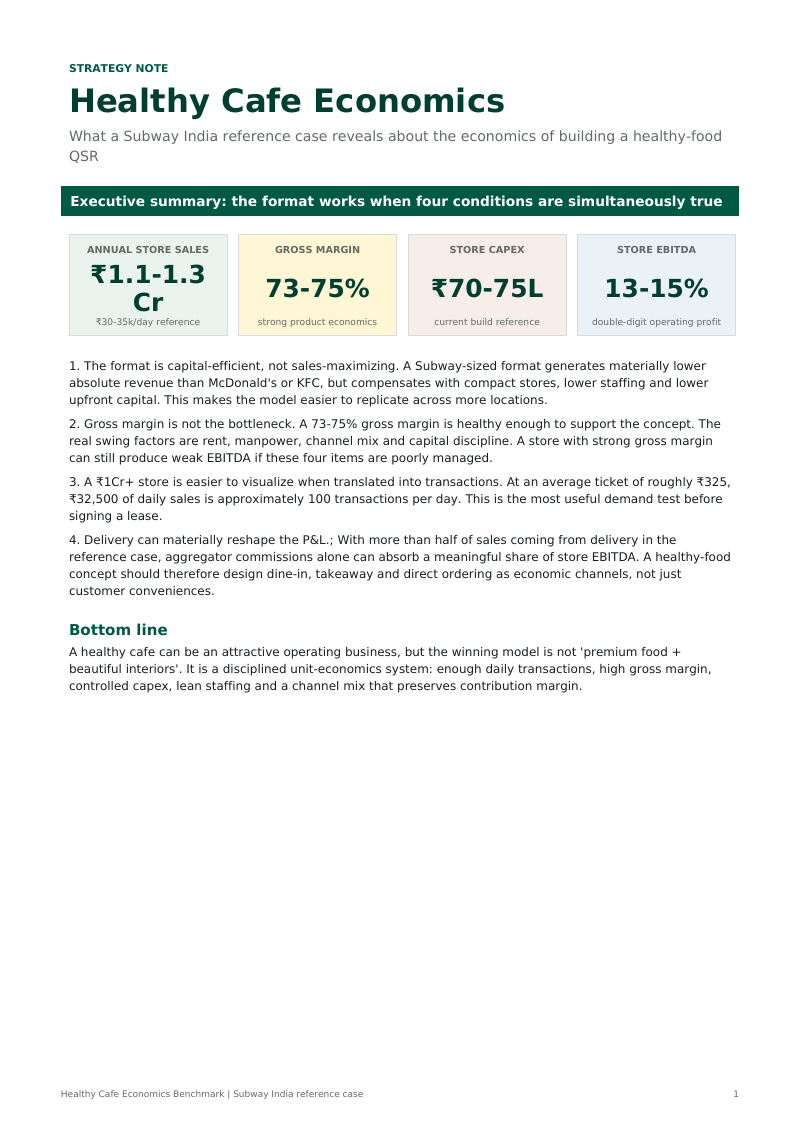
Executive summary: the format works when four conditions are simultaneously true
| Metric | Reference | Note |
|---|---|---|
| Annual store sales | ₹1.1-1.3 Cr | ₹30-35k/day reference |
| Gross margin | 73-75% | strong product economics |
| Store capex | ₹70-75L | current build reference |
| Store EBITDA | 13-15% | double-digit operating profit |
-
The format is capital-efficient, not sales-maximizing. A Subway-sized format generates materially lower absolute revenue than McDonald's or KFC, but compensates with compact stores, lower staffing and lower upfront capital. This makes the model easier to replicate across more locations.
-
Gross margin is not the bottleneck. A 73-75% gross margin is healthy enough to support the concept. The real swing factors are rent, manpower, channel mix and capital discipline. A store with strong gross margin can still produce weak EBITDA if these four items are poorly managed.
-
A ₹1Cr+ store is easier to visualize when translated into transactions. At an average ticket of roughly ₹325, ₹32,500 of daily sales is approximately 100 transactions per day. This is the most useful demand test before signing a lease.
-
Delivery can materially reshape the P&L.; With more than half of sales coming from delivery in the reference case, aggregator commissions alone can absorb a meaningful share of store EBITDA. A healthy-food concept should therefore design dine-in, takeaway and direct ordering as economic channels, not just customer conveniences.
Bottom line
A healthy cafe can be an attractive operating business, but the winning model is not 'premium food + beautiful interiors'. It is a disciplined unit-economics system: enough daily transactions, high gross margin, controlled capex, lean staffing and a channel mix that preserves contribution margin.
1 | PEER ECONOMICS
Subway's structural advantage is capital and labor efficiency - not the highest revenue per store
Across major QSR formats, the operating models are fundamentally different. Larger dine-in formats generate more absolute sales, while Subway trades some revenue intensity for a smaller footprint, lower staffing and lower build cost.
| Brand | APC | Avg sales/day | Gross margin | Store EBITDA |
|---|---|---|---|---|
| Domino's | ₹200-250 | ₹0.70-1.30L | 75-77% | 19-21% |
| McDonald's | ₹350-400 | ₹1.50-1.55L | 69-71% | 12-14% |
| KFC | ₹350-400 | ₹0.90-1.30L | 69-70% | 16-18% |
| Burger King | ₹250-300 | ₹1.00-1.40L | 67-69% | 10-12% |
| Subway | ₹300-350 | ₹0.30-0.35L | 73-75% | 13-15% |
| Brand | Capex | Avg staff | Store size | Sales/day/sq ft | Food : Beverage |
|---|---|---|---|---|---|
| Domino's | ₹80-150L | 30-35 | 800-1,000 | ₹80-110 | 90-95% : 5-10% |
| McDonald's | ₹150-250L | 45-50 | 1,750-2,250 | ₹70-90 | 70-75% : 25-30% |
| KFC | ₹100-200L | 35-40 | 800-1,500 | ₹90-110 | 75-80% : 20-25% |
| Burger King | ₹200-250L | 40-45 | 1,500-2,000 | ₹70-90 | 85-90% : 10-15% |
| Subway | ₹55-60L | 8-10 | 500-600 | ₹60-75 | 90-95% : 5-10% |
A midpoint view makes the strategic trade-off clearer
| Brand | Midpoint annual sales | Midpoint EBITDA | Midpoint capex | Simple capex/EBITDA |
|---|---|---|---|---|
| Domino's | ₹3.65Cr | ₹73L | ₹115L | ~1.6x |
| McDonald's | ₹5.57Cr | ₹72L | ₹200L | ~2.8x |
| KFC | ₹4.02Cr | ₹68L | ₹150L | ~2.2x |
| Burger King | ₹4.38Cr | ₹48L | ₹225L | ~4.7x |
| Subway | ₹1.19Cr | ₹17L | ₹58L | ~3.5x |
Interpretation: Domino's combines high sales density with strong store EBITDA. McDonald's and KFC generate much larger absolute sales but require significantly more capital and staff. Subway's economics are built around replication efficiency: less revenue per store, but a smaller operational footprint and lower capital at risk.
2 | STORE ECONOMICS
The reference store is proving more productive without giving up gross margin
The operating trend is constructive: sales productivity has improved, gross margin has remained stable and dine-in has recovered modestly. This suggests that the model can grow revenue without materially changing product-cost economics.
| Metric | FY2024 | FY2025 | FY2026 |
|---|---|---|---|
| COCO stores at year-end | 311 | 434 | 678 |
| COCO stores opened | 101 | 117 | 151 |
| Average capex / store opened | ₹73.0L | ₹68.0L | ₹69.7L |
| Average store size opened | 563 sq ft | 516 sq ft | 557 sq ft |
| Average daily sales | ₹29,671 | ₹30,316 | ₹31,962 |
| Same-store sales growth | N/A | -2.4% | 6.2% |
| Gross profit margin | 72.47% | 71.51% | 72.03% |
| Delivery share | 58.97% | 59.54% | 55.50% |
| Dine-in share | 41.03% | 40.46% | 44.50% |
The economics become intuitive when translated into an operating day
| Reference-store midpoint | Value | What it means |
|---|---|---|
| Daily sales | ₹32,500 | A useful demand target for site underwriting |
| Transactions/day | ~100 | At ~₹325 average ticket |
| Annual sales | ₹1.19Cr | ~₹1Cr+ is not an abstract target |
| Gross profit | ₹88L | Before rent, staff, commissions and other opex |
| Store EBITDA | ₹16.6L | At a 14% midpoint EBITDA margin |
| Simple capex / EBITDA | ~4.2x | Using ₹70L capex; before tax/finance/WC |
Implication for a founder
Before choosing a location, convert the annual revenue target into transactions/day. If the catchment cannot plausibly support ~100 daily transactions at your expected average ticket, no amount of interior design will rescue the model.
3 | CAPITAL ARCHITECTURE
The biggest capex lesson: equipment matters more than interiors
A new-store build in the reference case lands around ₹70-75 lakh depending on region. The cost is not predominantly decorative fit-out; commercial equipment, power backup and operating infrastructure account for the majority of the budget.
| Region | Average capex | Per sq ft |
|---|---|---|
| North / South | ₹70.4L | ~₹11.1k/sq ft |
| West | ₹71.7L | ~₹11.3k/sq ft |
| East | ₹74.8L | ~₹11.8k/sq ft |
| FY26 average | ₹69.7L | 557 sq ft opened store |
| Cost bucket | Approx. cost | Share of ~₹70.4L |
|---|---|---|
| Interior development - total | ₹25.4L | 36% |
| Civil + interior works | ₹7.6L | 11% |
| Electrical | ₹3.8L | 5% |
| Plumbing + fire + facade | ₹4.5L | 6% |
| HVAC + fresh air / exhaust | ₹5.8L | 8% |
| Furniture | ₹3.8L | 5% |
| Equipment & smallware - total | ₹45.0L | 64% |
| Baking / proofing + speed ovens | ₹12.0L | 17% |
| Refrigeration + sandwich lines | ₹7.0L | 10% |
| Power backup systems | ₹9.6L | 14% |
| Stainless steel equipment | ₹7.0L | 10% |
What this changes in a cafe build
The correct order is menu -> equipment list -> kitchen workflow -> utilities -> customer area -> aesthetics. Reversing that sequence often creates unnecessary civil work, oversized kitchens or expensive equipment that the menu does not need.
Use two capex benchmarks, not one
₹55-60L is a useful 'high-efficiency' industry benchmark; ₹70-75L is a more conservative current-build reference. Underwrite the business on the latter and treat any savings as upside rather than making the business case depend on unusually low capex.
4 | CHANNEL ECONOMICS
Delivery is a growth channel - but it can also be the largest hidden EBITDA leak
The reference network remains delivery-heavy, although dine-in share improved in FY2026. This matters because delivery orders carry aggregator commissions, packaging and promotional funding that do not apply to dine-in transactions.
| Metric | Value | Note |
|---|---|---|
| Delivery share | 55.5% | FY2026 reference |
| Dine-in share | 44.5% | FY2026 reference |
| Aggregator fee | 10-18% | plus applicable taxes |
| SSSG | 6.2% | FY2026 growth |
| Midpoint sensitivity | Value |
|---|---|
| Annual store sales | ₹1.19Cr |
| Delivery sales at 55.5% mix | ~₹65.8L |
| Aggregator commission at 10% | ~₹6.6L/year |
| Aggregator commission at 18% | ~₹11.9L/year |
| Midpoint implied store EBITDA | ~₹16.6L/year |
| Commission / implied EBITDA | ~40%-71% |
Three implications for a new healthy-food format
1. Price delivery correctly
Do not treat delivery as the same product sold through another channel. The channel has a different contribution margin and should be priced, promoted and packaged accordingly.
2. Design for takeaway and direct ordering from day one
Every percentage point of demand shifted from high-commission delivery toward takeaway, direct digital ordering or dine-in can improve store economics without changing food cost.
3. Track contribution margin by channel - not only total sales
A store can grow GMV while EBITDA deteriorates. The operating dashboard should separate dine-in, takeaway, direct delivery and aggregator delivery economics.
5 | FOUNDER PLAYBOOK
The benchmark is most useful as a decision framework before a lease is signed
For a founder building a healthy-food concept, the key is to translate the benchmark into a small number of non-negotiable thresholds. These are not targets to copy blindly; they are questions the concept must answer convincingly.
| Decision question | Reference threshold | Founder interpretation |
|---|---|---|
| Can the catchment support demand? | ~₹30-35k/day | Reverse-engineer into bills/day before choosing the site |
| Is the average ticket credible? | ₹300-350 | Price architecture must match the local customer |
| Can food cost stay controlled? | 26-28% COGS | Premium ingredients cannot be allowed to erase gross margin |
| Can the store run lean? | 8-10 staff | Menu complexity should not require restaurant-level manpower |
| Is capex disciplined? | ~₹70-75L | Set a ceiling before design development begins |
| Does the store create operating profit? | 13-15% EBITDA | Revenue growth without EBITDA is not the goal |
| Is delivery dependence survivable? | Stress-test 10-18% fee | Model channel contribution, not only top-line sales |
Five high-value conclusions
1. Underwrite on ₹70L+ capex; optimize toward ₹55-60L
This keeps the business case conservative. If the model only works at the lowest possible build cost, the risk is already too high.
2. Think in transactions, not crores
A ₹1.19Cr store at a ₹325 ticket is roughly 100 bills/day. That is a far more actionable demand question than asking whether a location can 'do ₹1Cr'.
3. Standardize the backend; customize the customer experience
The economic power of a healthy-food concept comes from a limited set of standardized ingredients, portions and processes that can create many customer-facing combinations without creating kitchen complexity.
4. Beverages are a potential ticket-size lever
The reference format has a relatively low beverage contribution versus McDonald's and KFC. A healthy cafe with functional drinks, smoothies, protein beverages or coffee may have room to increase mix and average ticket if beverage margins are attractive.
5. The best site is the site that passes the unit-economics test
Visibility and aesthetics matter only after the rent-to-sales equation works. Demand, lease economics and capex should be solved before emotional attachment to a location.
METHODOLOGY & NOTES
Definitions, derivations and source notes
All analytical conclusions in this report are based on the operating, financial and industry data disclosed in the EverBrands India Draft Red Herring Prospectus dated 28 September 2026, including the embedded industry report prepared by The Knowledge Company (TKC).
How the numbers have been treated
| Category | Treatment in this report |
|---|---|
| Company operating data | COCO store count, average daily sales, gross margin, delivery/dine-in mix, historical capex per opened store, average store size and rollout data are used as observed operating references. |
| Industry benchmarks | Peer APC, gross margin, store EBITDA, capex, staffing, store size and sales/day are used as market benchmarks, not as audited company-store P&Ls.; |
| Derived metrics | Annualized sales, midpoint EBITDA, rough capex/EBITDA, implied transactions/day, capex-per-sq-ft and delivery-commission sensitivities are arithmetic derivations from the disclosed inputs. |
| Capex convention | The report uses ~₹70-75L as the primary planning reference because it aligns with recent average COCO store capex and forward new-store estimates. ₹55-60L is retained as a high-efficiency industry comparison. |
Primary reference sections
-
New COCO store capex, rollout process, historical capex per store and store size: printed pages 120-123.
-
India QSR market size, growth and format mix: printed page 201.
-
Peer store economics - Domino's, McDonald's, KFC, Burger King and Subway: printed page 206.
-
COCO operating metrics, delivery/dine-in mix, gross margin, same-store growth and aggregator commission ranges: printed pages 410-416.
Important limitations
This report is an educational business-analysis summary. It is not a franchise offer, investment recommendation, valuation opinion or forecast of store performance. Actual economics can vary materially by city, rent, property type, menu, pricing, sourcing, staffing, equipment specification, taxes, financing, working capital, maintenance capex, store maturity and delivery mix. Peer benchmarks may use different accounting conventions and may not be directly comparable. Simple capex/EBITDA ratios shown in this report are not IRRs or accounting payback periods and exclude financing, taxation, working capital, maintenance capex and lease-accounting effects.
Source: EverBrands India Limited, Draft Red Herring Prospectus dated 28 September 2026; industry benchmarking within the prospectus attributed to The Knowledge Company (TKC) report and other sources cited therein.